Visualize data
How to visualize data at NORMAP portal
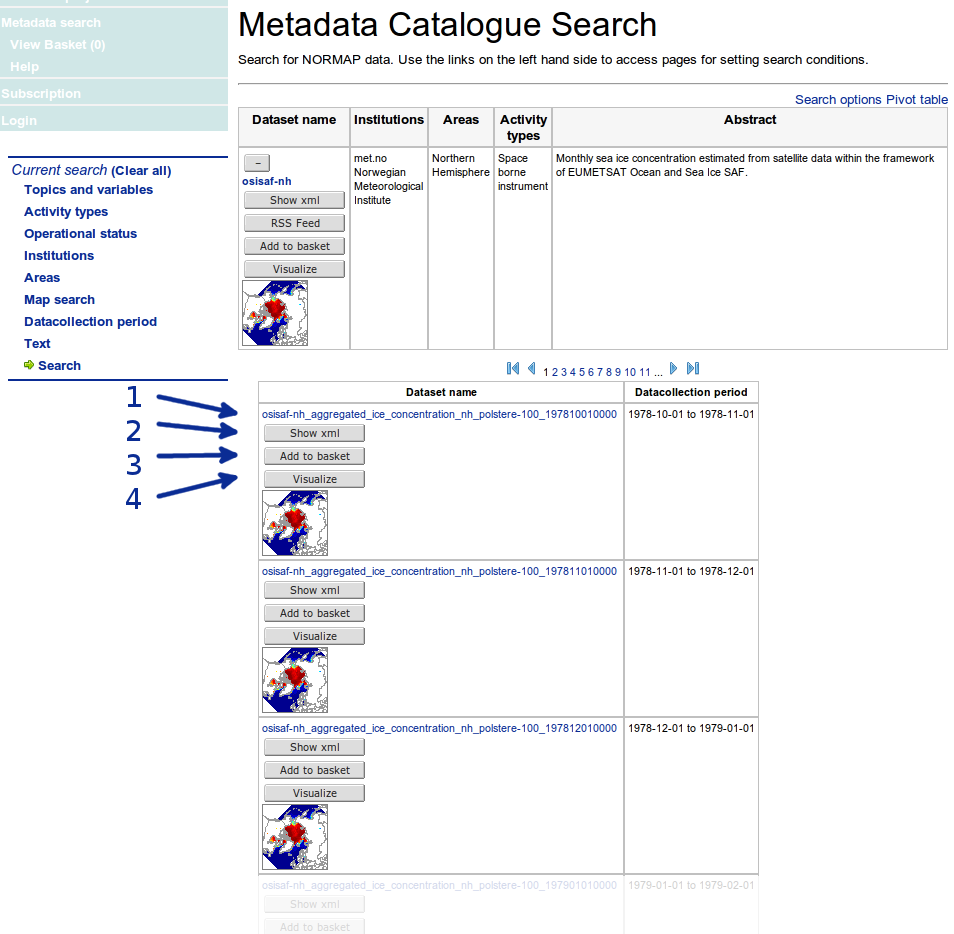
- In the table with the search results you will see several rows with datasets. Each dataset usually consists of several subdatasets for each time step. Click on the + (1) in order to expand the subdataset.
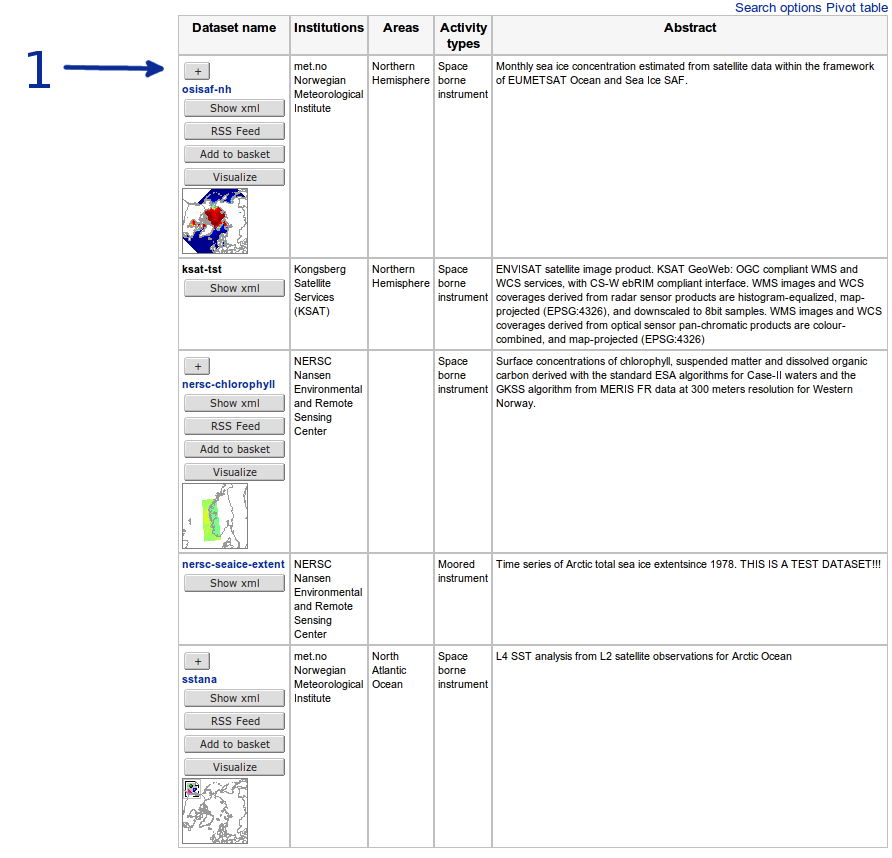
- For each subdataset in the list you will see: (1) link to the data download page; (2) Button for showing XML-file with metadata; (3) Button for adding dataset to the basket; (4) Button for visualization.
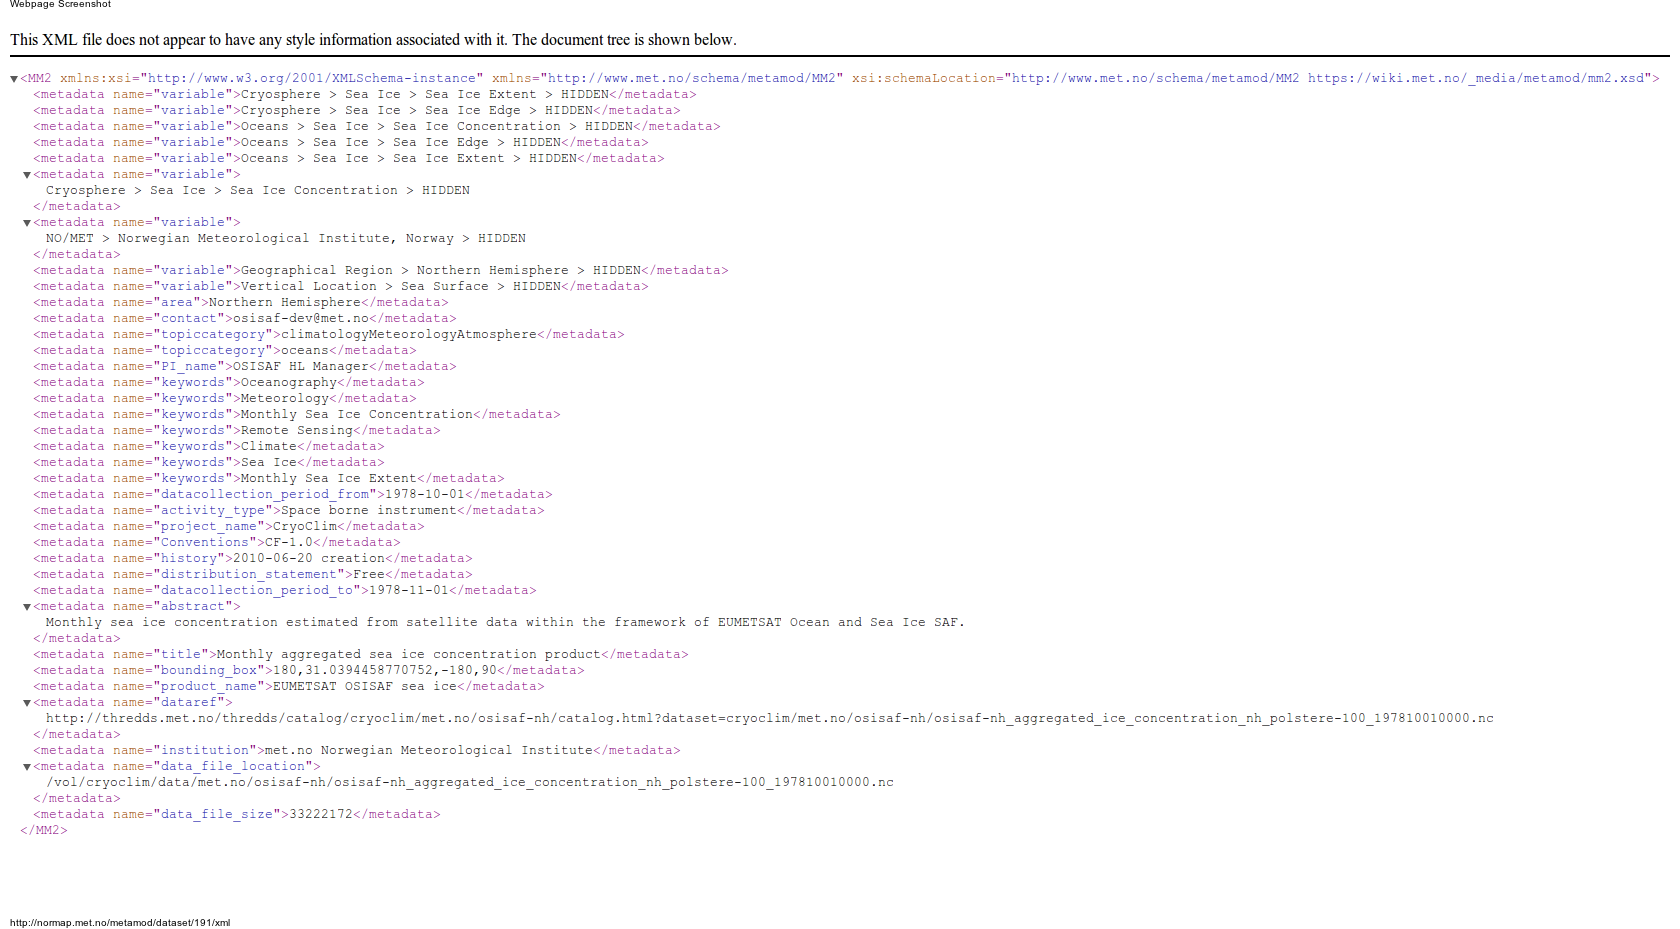
- Click on the 'Show xml button' and you will see an XML-file with all metadata for this dataset.
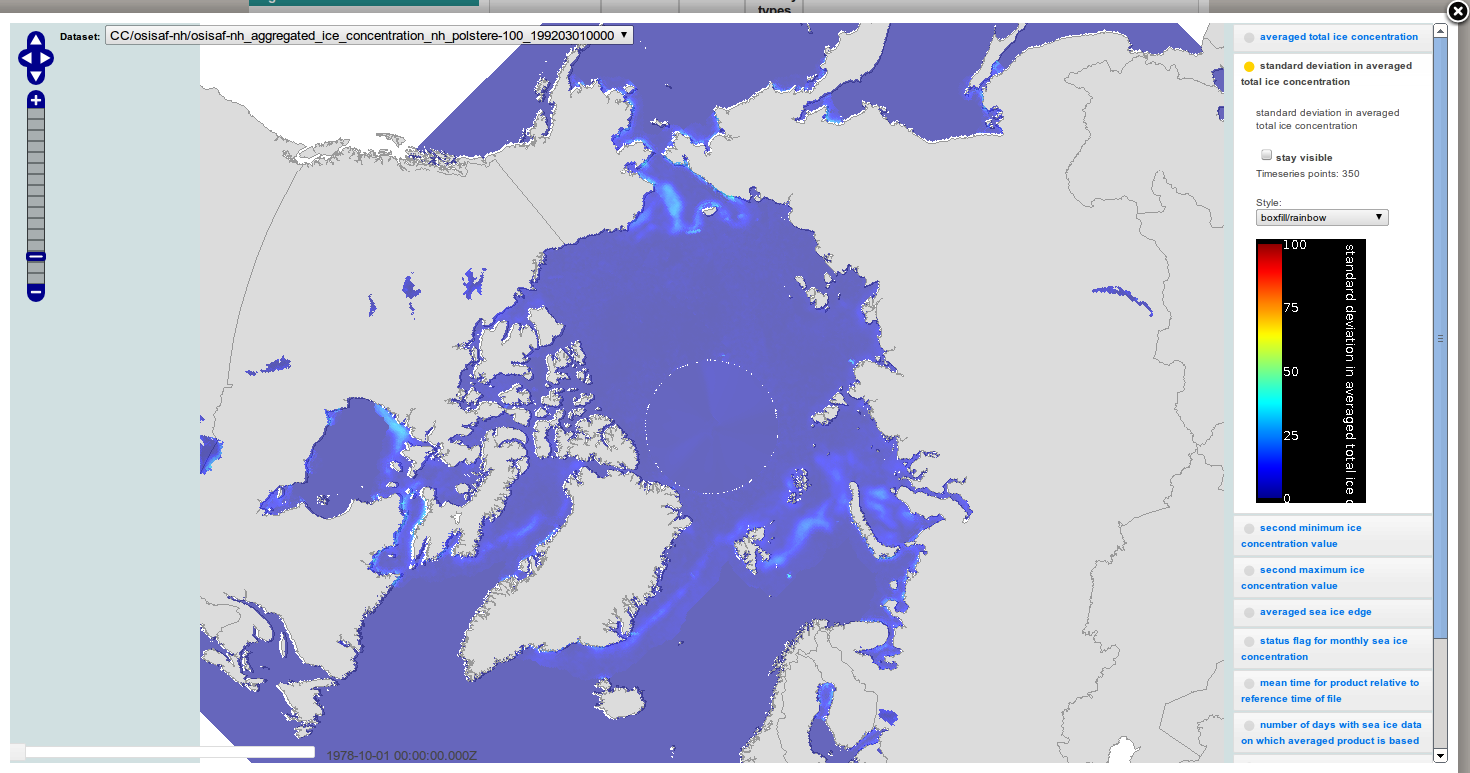
- Click on the 'Visualize' button and a viewer will open in the current window. In the left corner you will see controls for changing zoom and footprint of the window (that can also be changed with mouse pan and scroll) and selector of available subdatasets. In the right menu you will see a list of variables in the viewed dataset (in our case: "averaged total ice concentration", "standard deviation in averaged total ice concentration", "second minimum ice concentration", etc). The map will show spatial distribution of the first variable in the list.
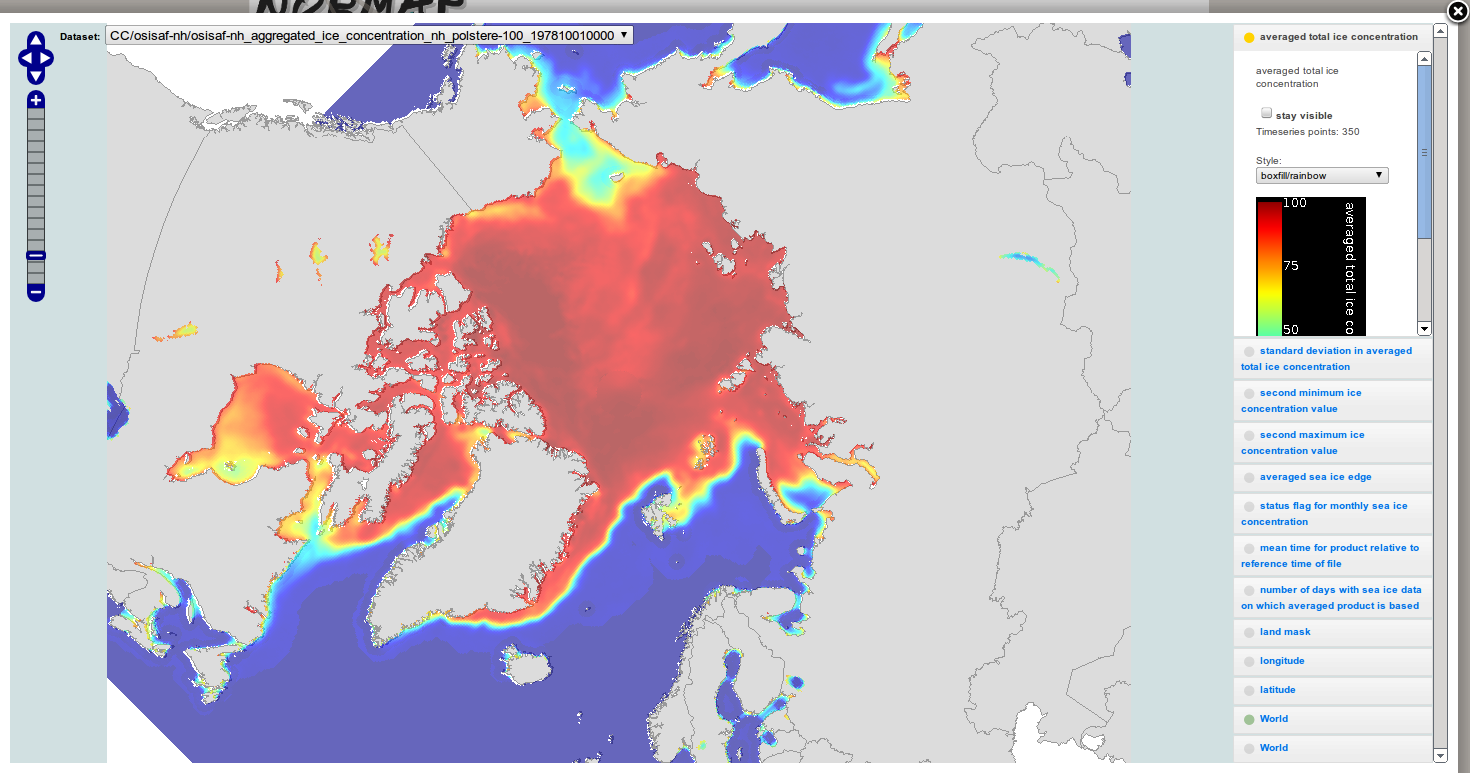
- Click on another variable name and you will see another map. You may also choose color legend style from the 'style' drop-down menu.
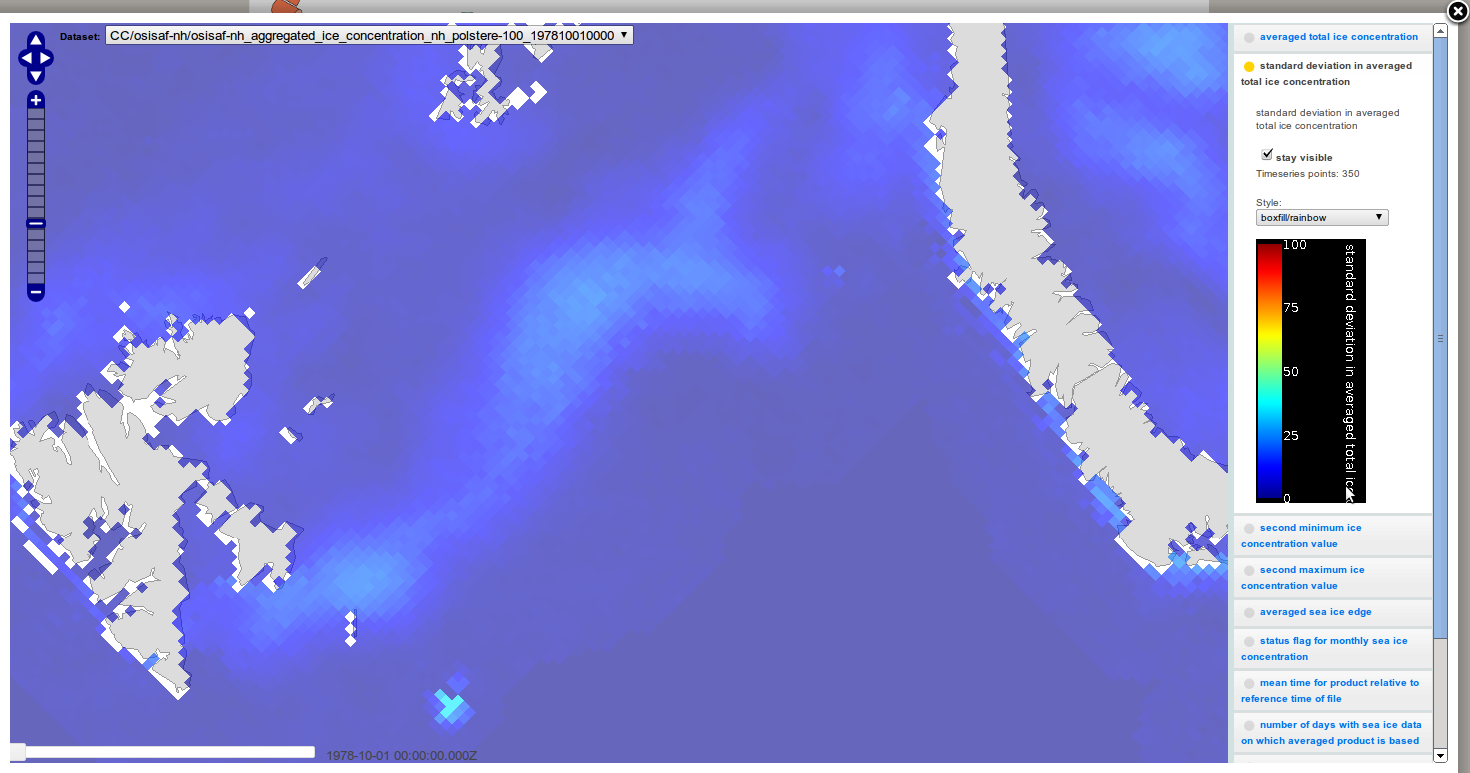
- You can click the check-box 'stay visible' and click on another variable name. In that case both variables will be shown on the same figure, one being semitransparent.
- If you find this data relevant you can close the viewer and proceed to the download page. Read more about how to download NORMAP data
Footer here
